
TNNA (The National Needlearts Association) held an early morning meeting during the h+h americas trade show in early May. Many of you may remember that during the pandemic the TNNA organization suspended operations. In the last few years, a dedicated group of volunteers have been working to rebuild the organization. The current plan to is to be a volunteer led organization. I’ve talked with volunteers a few times in the last few years monitoring the groups progress in revitalizing TNNA. It was wonderful to see a dedicated group get together during the h+h show.
Before I get into the survey results, I want to commend the group working to bring TNNA back. Revitalizing something that has been on pause is far more work than most people will ever realize! Many of the volunteers also run their own stores, making it a complicated juggling match. They continue to make slow and steady progress. They have re-launched memberships, and the membership is growing. They continue to promote Local Yarn Store day, and have even relaunched member education classes.
They also ran a survey among retailers to compare 2024’s results to 2023. It’s often challenging to get good information on what is happening on the ground in many different segments of craft. The vast majority of respondents are yarn stores, and they had interesting information to share about how things are trending. Read on if you are curious as to what is happening in independent local yarn store retailers.
Store Demographics
The vast majority of stores responding came from the US, with an additional small percentage from Canada.

Source: TNNA Industry Survey, courtesy of TNNA
Over 50% of the respondents had been in business for greater than 10 years, which is pretty amazing! It is also important to understand the context for the size of these retailers.

Source: TNNA Industry Survey, courtesy of TNNA
The audience in the room at h+h americas all seem to agree we would like to increase that percentage over $500,000 revenue (insert cheeky smile here). Respondents really did come from across the spectrum in terms of revenue.
Overall, the majority reported an increase of sales in 2024 (67.9%). Just under 80% were up 15% or less, with 20% up over 15%.

Source: TNNA Industry Survey, courtesy of TNNA
The next question digs further into what is happening with sales. Is that increase all due to cost increases, or is there an inventory component? Sixty percent received more inventory in 2024 than 2023.

Source: TNNA Industry Survey, courtesy of TNNA
77.2% received up to 15% more in inventory in 2024 versus 2023.
How Seasonality affects businesses
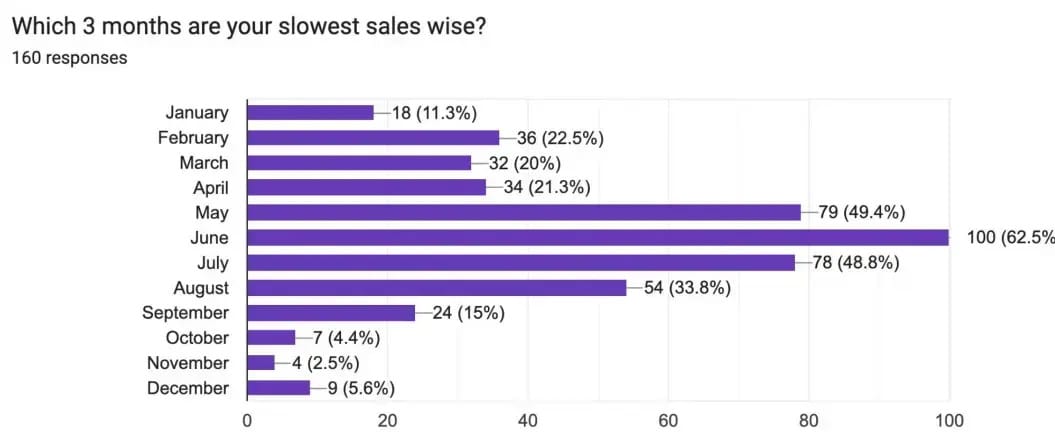
Next, the survey focused on understanding the busiest and slowest months of the years.

Source: TNNA Industry Survey, courtesy of TNNA
It’s clear from the trend that October-January were the busiest months for the majority of respondents. When I see numbers like this, I get curious about the outliers. It would be very interesting to dig a little deeper into the numbers for those that are seeing the busier months outside of October-January. Is it yarn crawls, it is festivals, is it just weather- what is driving these months to be so busy for them? And more importantly is it something other shops can replicate to drive sales?
Source: TNNA Industry Survey, courtesy of TNNA
Conversely, May to August are the slower months. This makes a lot of sense, as there is seasonality for many yarn retailers. It seems like June is probably the month to schedule a shop closure for vacation, with it being so slow for so many.
What are the big trends?
There were several areas of the survey that highlighted trends. The survey covered which categories were growing versus shrinking, how offering classes fared, as well as key trends within the industry.
Category Growth & Decline

Source: TNNA Industry Survey, courtesy of TNNA

Source: TNNA Industry Survey, courtesy of TNNA
What is really interesting about this information is that Lace & fingering yarn produced mixed results- with pretty close percentages reporting it doing better and worse. This would also be an interesting area to investigate. Why are some stores doing better than others in this particular category? And are there lessons learned from the companies where it is growing to help the retailers where it is shrinking?
Outside of Lace & fingering, other categories had more pronounced results. Chunky & Bulky and Super Bulky are really down for some pretty sizable percentages of retailers. Sport & DK as well as Worsted & Aran both performed better for the majority of respondents.
Class Attendance
Almost all respondents offer classes (92.5%). And 2024 continue to see class growth for the majority of respondents.

Source: TNNA Industry Survey, courtesy of TNNA
Trends

Source: TNNA Industry Survey, courtesy of TNNA
Trends is also an interesting topic to understand. There is a large increase in crochet interest and demand for crochet classes. Others reported growth in adjacent categories. Customers were interest in new-to-them crafts - needle felting, wet felting, spinning, weaving, cross stitch, needle point. This provides a lot of food for thought for artisans supplying independent retailers. Some new opportunities are opening up when retailers see new demand from their customers.
Final thoughts
Overall - sales were up 7% while inflow of inventory was up 5%. Ending inventory in 2024 was down 4%. That means that stores overall were much more efficient with their inventory in 2024 than 2023.
This was a great first year of running their survey. The organization is planning to continue running their surveys each year to track how the industry is changing. You can learn more about TNNA as well as look to read the full survey results here.